Queue Aging Heatmap
A dashboard gadget for Jira Service Management that shows you which support queues are quietly going stale — before a customer tells you.
What it does
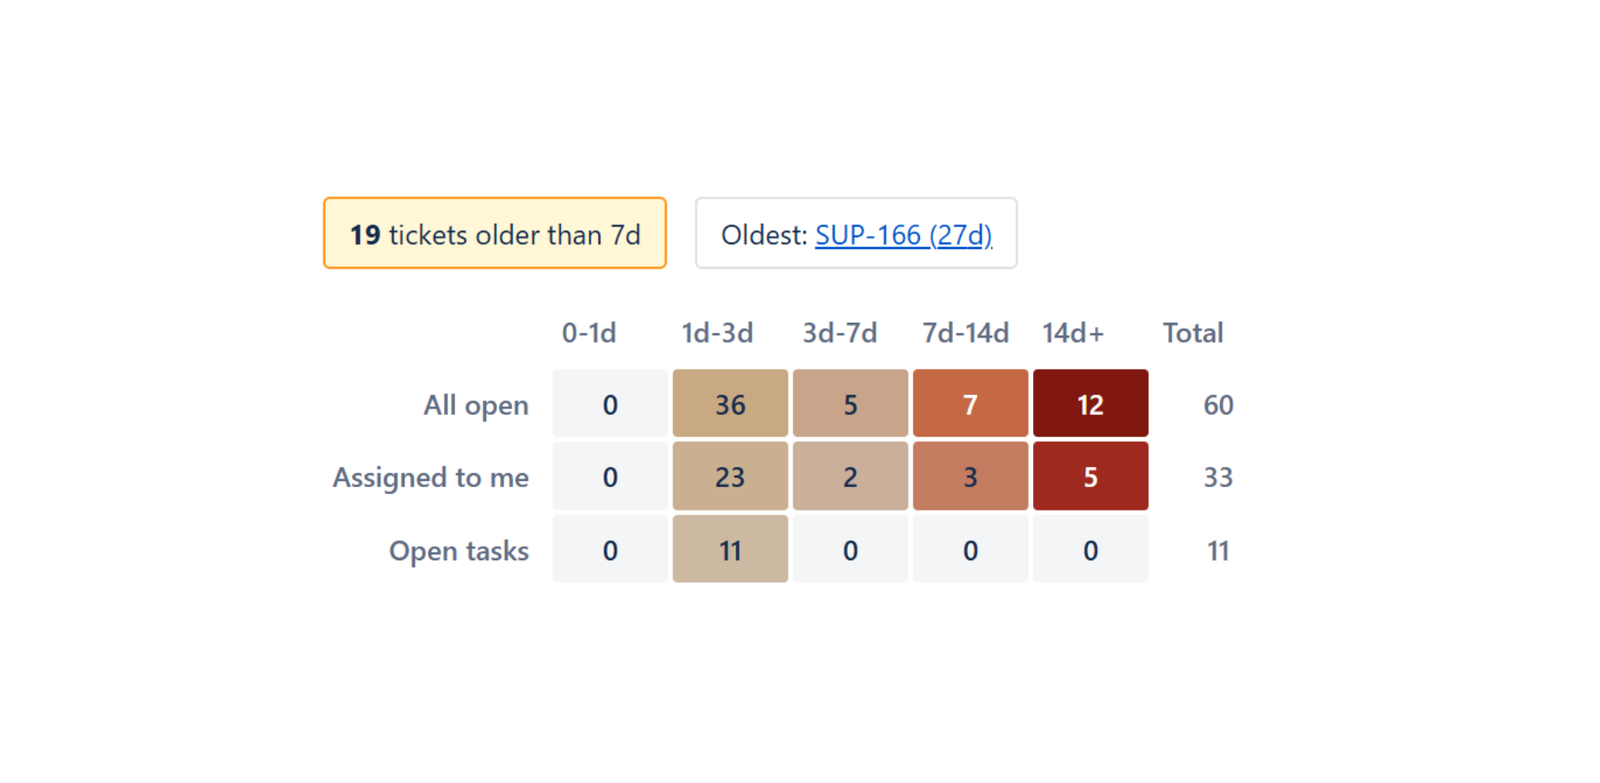
The gadget puts your open service desk tickets into a grid. Rows are your queues (or priorities, or agents). Columns are age buckets. Each cell shows how many tickets sit in that combination.
Colour is driven by age first and volume second, so a small pile of genuinely old work stands out more than a large pile of fresh work. Click any cell to see the tickets inside it and open them.
Installing
- From the Atlassian Marketplace listing, select Get it now and choose your site. You'll need to be a Jira administrator, or have an administrator approve the request.
- Open any Jira dashboard and select Add gadget.
- Find Queue Aging Heatmap in the list and add it.
- The gadget opens in configuration mode the first time. Follow the next section.
The app works with Jira Service Management projects. It doesn't require any setup outside the gadget itself — no admin configuration, no API keys, no connected accounts.
Configuring the gadget
Service project
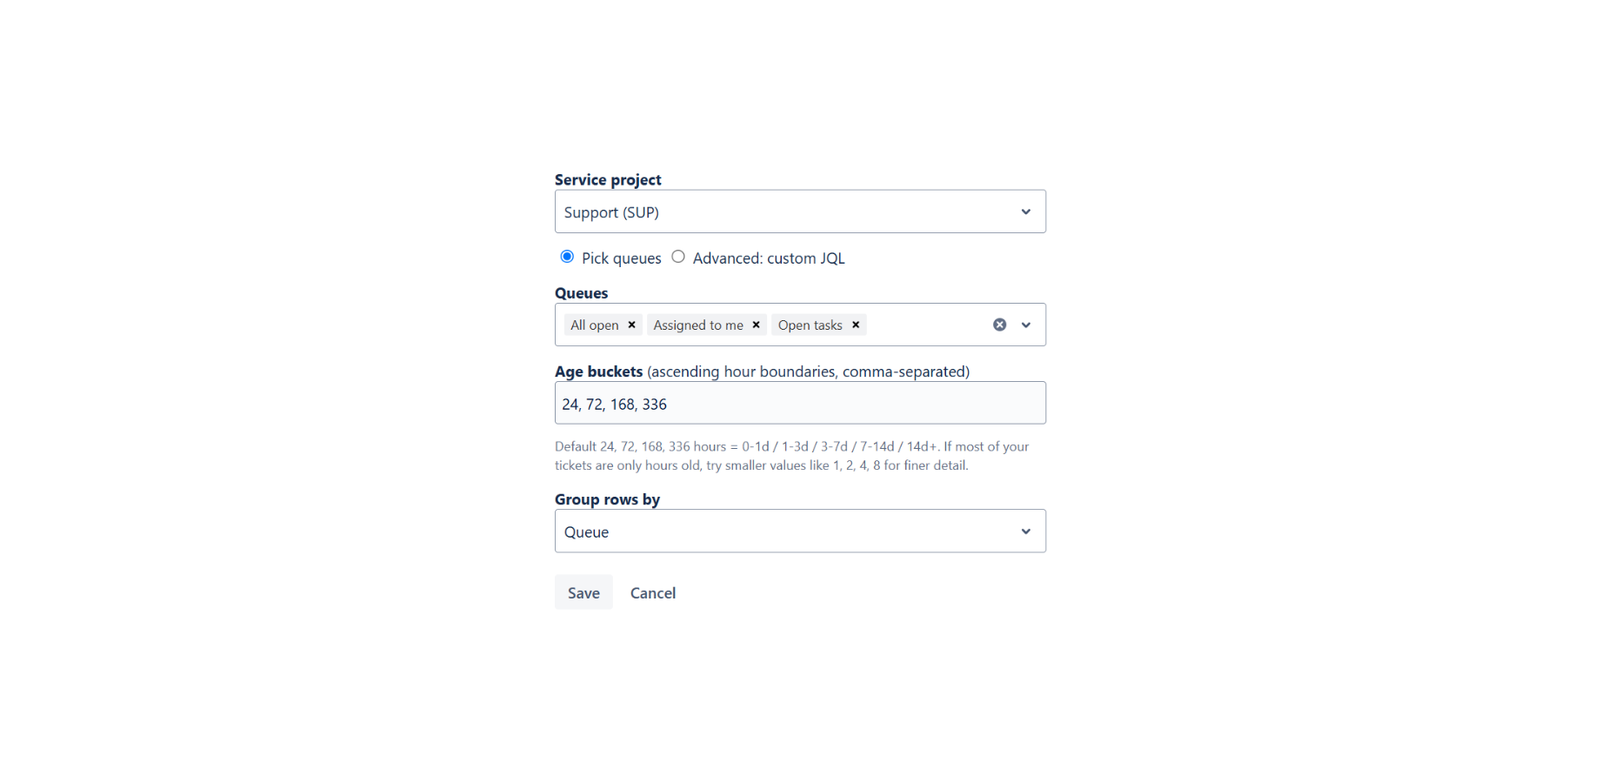
Pick the Jira Service Management project you want to look at. One project per gadget — add a second gadget to your dashboard if you want to watch two.
Queues
Choose one or more queues from that project. These are the same queues your agents see, read directly from Jira, so the numbers here match what they're working from.
If you need something the queue list can't express, switch to Advanced: custom JQL and write your own query instead. The gadget validates it before running, so a typo gives you an error rather than a silently empty grid.
Age buckets
The columns of the grid, given as ascending hour boundaries separated by commas. The default is 24, 72, 168, 336, which produces the columns 0–1d, 1–3d, 3–7d, 7–14d and 14d+.
You can use any boundaries you like. A team that works to same-day resolution might prefer 1, 2, 4, 8 to see the day in hours. A team with longer-running requests might stretch to 72, 336, 720.
Group rows by
Choose whether each row is a queue, a priority, or an assignee. Queue answers "which part of the desk is falling behind." Priority answers "are we letting the urgent things age." Assignee answers "is one person carrying stale work nobody else can see."
Reading the heatmap
Above the grid are two callouts: how many tickets are older than seven days, and the single oldest ticket with a direct link to it. If you only look at one thing, look at these.
In the grid itself, colour intensity comes mostly from which age bucket a cell is in, and partly from how many tickets are in it. A cell with twelve tickets at 14d+ will always read as more serious than a cell with thirty-six tickets at 1–3d, because thirty-six tickets two days old is a working queue and twelve tickets a fortnight old is a problem.
The Total column on the right gives each row's own ticket count.
Why is there no totals row? When you select several queues, the same ticket can appear in more than one of them — most desks have an "All open" queue that overlaps everything else. Adding the columns up would count those tickets twice and produce a number larger than the real total. So when the gadget detects overlapping queues, it hides the bottom totals row rather than showing you a misleading figure.
Refreshing
Results are cached for 15 minutes so the gadget loads instantly and doesn't hammer Jira every time someone opens the dashboard. The header line tells you whether you're looking at live or cached data and when it was fetched. Select Refresh (bypass cache) for numbers as of right now.
Drilling into a cell
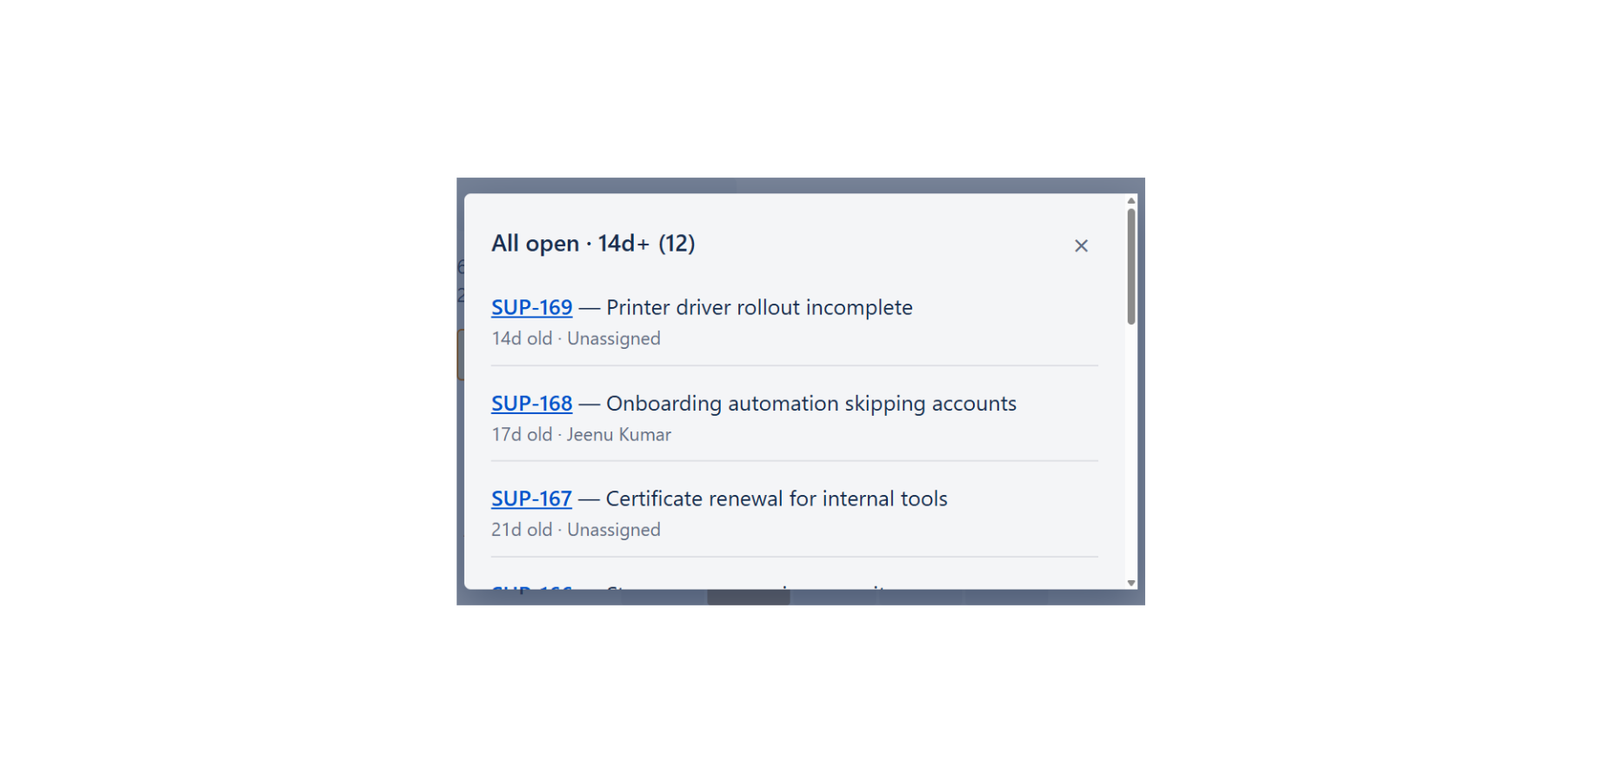
Select any cell to list the tickets it contains — issue key, summary, exact age, and who it's assigned to. Select a key to open that ticket in Jira.
Cells list up to 100 tickets. If a cell holds more than that, the panel says so rather than quietly truncating.
Pricing
Free for sites with up to 10 users. Not a trial — a permanent free tier with the full feature set.
Above 10 users it's charged per user per month, billed by Atlassian through your existing account. Current rates are on the Marketplace listing.
Questions
What permissions does the app ask for, and why?
Four, all read-only:
read:servicedesk-request— to list your service desks and queuesread:jira-work— to read the tickets in themread:jira-user— to turn assignee IDs into names for displaystorage:app— to save your gadget configuration and the 15-minute cache
The app cannot create, edit, transition, comment on, or delete anything in Jira. It reads tickets using the permissions of whoever is viewing the dashboard, so nobody sees a ticket through the gadget that they couldn't already see in Jira.
Will it slow down my dashboard on a large project?
Results are aggregated once and cached for 15 minutes, so repeat loads are served from cache rather than re-querying Jira. Queries are paginated, and each cell caps its stored ticket list at 100. On a project with thousands of open tickets, the first load takes a moment and every load after that is fast.
Where does my data go?
Nowhere outside Atlassian. The app is built on Atlassian Forge and runs on Atlassian's own infrastructure. It makes no network calls to any external host — no analytics, no third-party services, no external storage. Nothing is transmitted anywhere for us to see.
What it keeps, inside Atlassian's own app storage: your gadget configuration, and a cached aggregate that expires after 15 minutes. Assignees are stored only as Atlassian account IDs; display names are fetched fresh from Jira each time the gadget loads and are never written to storage.
Full detail is in the privacy policy.
Can I put more than one on a dashboard?
Yes. Each gadget keeps its own configuration, so you can run one per project, or several against the same project grouped different ways.
Something's wrong, or I need a feature.
Email support@earlywick.com. Earlywick is a small operation, which means you're writing to the person who builds the app rather than a ticket queue. Feature requests genuinely do get read.